In what shouldn’t even be news, scientists have discovered warmth and rising CO2 are beneficial to crops, whereas cold and falling CO2 lead to declines in crop production.
Scientists have determined the “main factor” directly improving post-1960 crop yields across China is a warming climate (Chen and Sun, 2024). Warming expands the growth area for late-maturing plant varieties, reduces damage from cold temperatures, and extends growing seasons.
The authors point to a link between warming, declining sea ice, the Arctic Oscillation, and East Asian winter monsoons. Then they extend these relationships to crop growth trends in China.
Rising CO2 and its photosynthesis enhancement is another factor driving China’s rising food production.
“The effect of Arctic sea ice on Chinese crop yield is an indirect process, while the main factor that really affects China’s crop yield directly is the local air temperature change. When the air temperature in China is high, the yield will show an increasing trend, and vice versa. [T]he change in thermal conditions may also reduce the low temperature and cold damage and increase the area of late-maturing crop varieties.”
“Besides, CO2 is an essential element of crop photosynthesis and a major climate change scenario construction indicator. Increasing CO2 concentration in the Earth’s atmosphere can increase the photosynthetic rate of crops, which directly stimulates crop growth and increases the dry matter content, resulting in increased food production.”
With comparatively stable CO2 levels over 10,500 years, temperatures still fluctuated within a range of -4 to +3 °C.
Yet, German Constitutional High Court preposterously claims there is an “almost linear relationship” between CO2 and temperature.
Junk mandated to “science” by law?
Alpine glaciers: spoilsports for the CO2 climate hypothesis
The CO2 introduced into the atmosphere by humans through the burning of fossil fuels is declared by today’s climate science as a “greenhouse gas” to be the decisive factor in an impending climate catastrophe. It is claimed that “never before” temperatures on earth had been rising at such rates as nowadays. The Alpine glaciers are often referred to as key witnesses to this argument. This “eternal” ice is said to be under existential threat from climate change. The “death” of glaciers is mourned on radio, in TV-shows and in the printed press. To prevent this impending catastrophe, the advanced civilization to which we owe our comparatively healthy and carefree lifestyle must be scrapped: let’s do away with coal, oil, gas and nuclear energy, with cars, steel, aluminum, concrete….and as a consequence also with modern medicine.
By Fred F. Mueller
Fig. 1:: Just as its peers in the Alps, the Great Aletsch Glacier – seen here from the Jungfraujoch – is being stylized as a “crown witness” of CO2-induced climate change (Photo: Private)
The United Nations assumes that the CO2 emissions introduced into the atmosphere by humans are warming the climate due to a “greenhouse effect”. This greenhouse effect is said to endanger our existence. This thesis is propagated by its offshoot, the Intergovernmental Panel on Climate Change (IPCC), as irrefutable scientific truth. Claims to this effect are constantly repeated in countless scientific and journalistic publications. It is particularly emphasized that it is imperative to “recognize CO2 as the principal climate control knob” 1).
In the meantime, clever representatives of the “green” climate movement have ensured that this view has even been enshrined as an incontrovertible truth in supreme court rulings by the German Federal Constitutional Court and the European Court of Human Rights (ECtHR), among others.
Since this ruling, Germany is on a one-way highway to hell into an economic and social abyss. From now on all governments are obliged to reduce CO2 emissions to zero by 20453), regardless of the impact this has on the economy and the well-being of the population. Any fanatic NGO can sue the German state if it is not content with the reduction achieved. Worse still, the current greens, socialists and liberals government is already preparing further legislation to deny future governments any opportunity to revise this course again.
A law currently being prepared by (Liberal) Minister Buschmann is supposedly intended to “protect the constitutional court from undemocratic successor governments.” In reality, the new law will prevent even democratic majorities from overturning the Federal Constitutional Court ruling and the resulting regulations. Without any regard for the misery this will imply for the population.
Friedrich Merz and his conservative CDU have already signaled their support for this project.
How “healthy” were the Alpine glaciers from about 120,000 years ago until today. Over this time, the CO2 content fluctuated in a rather narrow range between 180 and 285 ppm, Figure 3.
Figure 3: The evolution of the CO2 content in the atmosphere over the last 120,000 years as determined by official climate science. The steep rise to today’s values only occurs abruptly at the very end of the graph. This extreme outlier is said to be causing a “glacial extinction” in the Alps (Graphic: author, with data from Our World in Data 6))
The evolution of CO2 levels shown in Figure 3 corresponds to what the IPCC calls the “stable pre-industrial state”, to which the German Federal Constitutional Court also refers in its “climate judgment”. In view of the fact that “climate science” describes the CO2 content of the atmosphere as the “decisive control knob for the climate”, the Alps should have had a stable climatic development and a correspondingly stable glacier cover before the start of significant human CO2 emissions.
When glaciers become climate crown witnesses
Fortunately, there is a very comprehensive study on the development of Alpine glaciers 7), in which their extent and mass were determined using complex simulation models. There is a corresponding short film on YouTube lasting approx. 2 minutes 8), which graphically summarizes the development of the last 120,000 years. Despite all reservations about such complex simulations, it should be noted that comprehensive geological and paleogeological studies of the entire Alpine region were used as “guard rails” for the stability of the models used. This also applies to the degree of correspondence between the end of the simulation run and the currently known state of the Alpine glaciers. Below are some still images from this video.
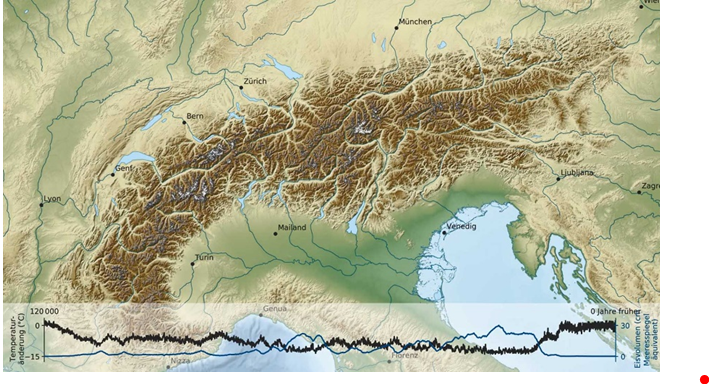
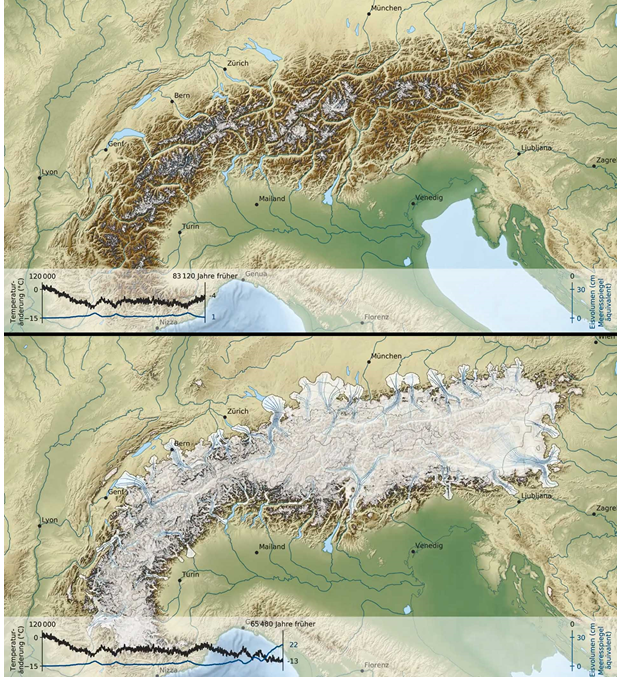
Figure 4: The current glaciation of the Alps. At this scale, significant glacier cover can only be seen around Mont Blanc and the Bernese Alps. At the bottom of the image, the temperature differences to today’s level (left scale axis) and the ice volume in cm sea level equivalent on the right scale can be seen in black (screenshot from https://www.youtube.com/watch?v=TXzExbdHuDM)
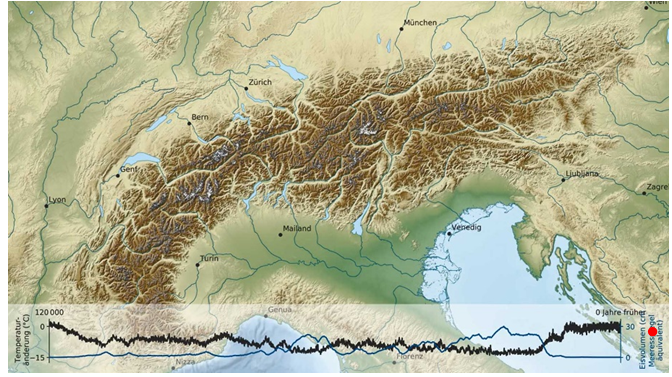
Figure 5: The ice cover of the Alps around 120,000 years ago, in the middle of the warm Eemian interglacial period (screenshot from https://www.youtube.com/watch?v=TXzExbdHuDM)
The comparison of Figures 4 and 5 shows that the ice cover of the Alps around 120,000 years ago was considerably less than it is today. This fact puts into perspective the terms “perpetual ice” and “dying glaciers” so often used today by the propagators of CO2 climate alarmism. At that time, the Eemian interglacial period 9) prevailed worldwide, one of the periodic warm interruptions of the ice ages that had prevailed for around 2.7 million years. It began around 126,000 years ago and lasted around 11,000 years. The temperature in Europe at that time was several degrees above the pre-industrial average temperature (until around 1850). During the entire Eemian period, the CO2 content of the atmosphere only fluctuated within a narrow range between 275 and 286 ppm. There is therefore no evidence of CO2 as the supposedly most important control knob for the climate in connection with the Eemian warm period and the subsequent glacial period.
The back and forth of the ice
The last glacial period was anything but uniform, quite the opposite. Both the temperatures and the ice volume fluctuated within wide limits, while the ice masses repeatedly buried and released enormous swathes of terrain, even outside the actual mountainous range. The following pictures give an impression of the occasionally extreme advances and retreats of the Alpine glaciers. The changing shoreline of the Adriatic Sea underscores that the sea level also fluctuated considerably during this time period.
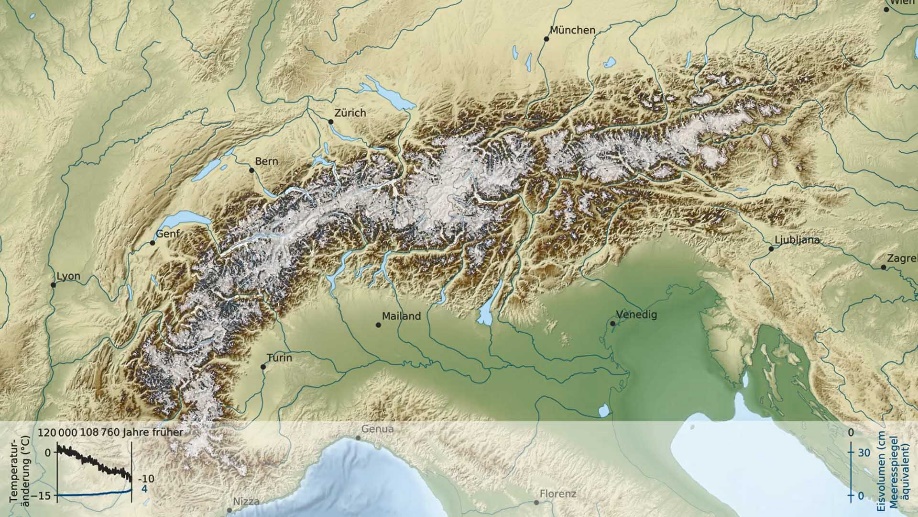
Figure 6: Ice cover of the Alps at the beginning of the last glacial period 108760 years ago. Temperatures had already fallen by a full 10 °C compared to today and the Alpine region would have become uninhabitable (screenshot from https://www.youtube.com/watch?v=TXzExbdHuDM)
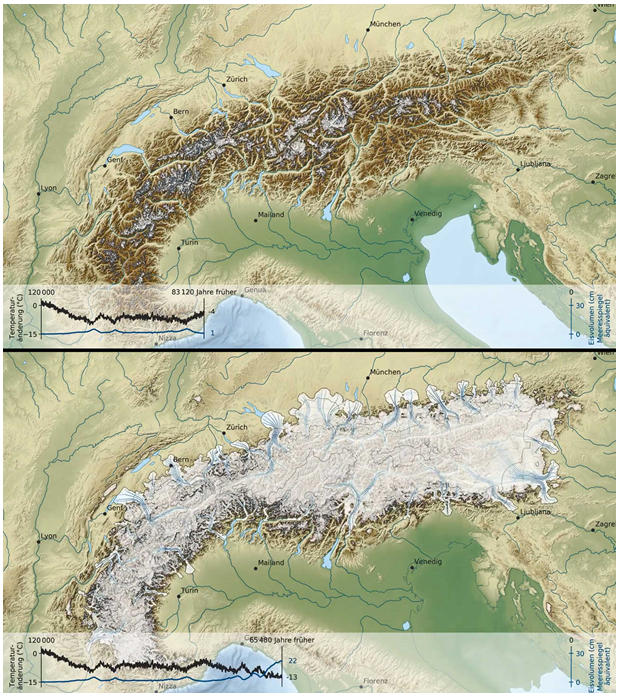
Figure 7: The glacial period was characterized by extreme swings in both directions. As the upper partial image shows, the ice cover had decreased considerably around 25,000 years after the beginning (Figure 6), and the temperature had risen by 6 °C compared to the previous stage. 17,000 years later, the Alpine region was suffocating under a gigantic ice sheet, and the temperature was 13 °C below today’s level. The northern Adriatic had almost disappeared from the map due to falling sea levels. (Screenshots from https://www.youtube.com/watch?v=TXzExbdHuDM)
Figure 8: After further extreme fluctuations, the ice masses advanced far in all directions at the peak of the glacial period about 24,500 years ago. In the north they advanced as far as Munich, and Zurich, Bern and Geneva disappeared under massive ice fields. Temperatures were 12 °C below today’s level, and the Adriatic Sea can only be glimpsed at the bottom right of the image. (Screenshot from https://www.youtube.com/watch?v=TXzExbdHuDM)
Figure 9: The end of the glacial period was anything but even too. After the glaciers had already melted quite extensively around the year 14,240 with comparatively mild temperatures (upper image), the glaciers expanded considerably again around 12,500 years ago and temperatures fell again by 7 °C below today’s level (screenshot from https://www.youtube.com/watch?v=TXzExbdHuDM).
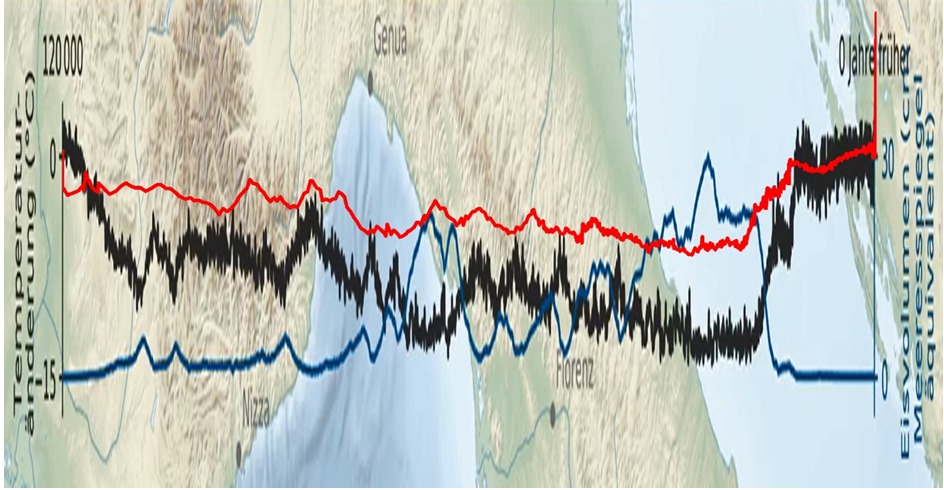
Figure 10: The joint representation of atmospheric CO2 content and temperature development over the course of the last glaciation period shows that the correlation between the two variables appears to be rather weak. In particular, the explosive rise in the red curve at the very end raises doubts. The course of the CO2 concentration with temperature can easily be attributed to outgassing or absorption due to higher or lower solubility in the sea in line with Henry’s law. An industrial influence can be ruled out except for the last 150 years or so. (Graphic: author + screenshot from https://www.youtube.com/watch?v=TXzExbdHuDM)
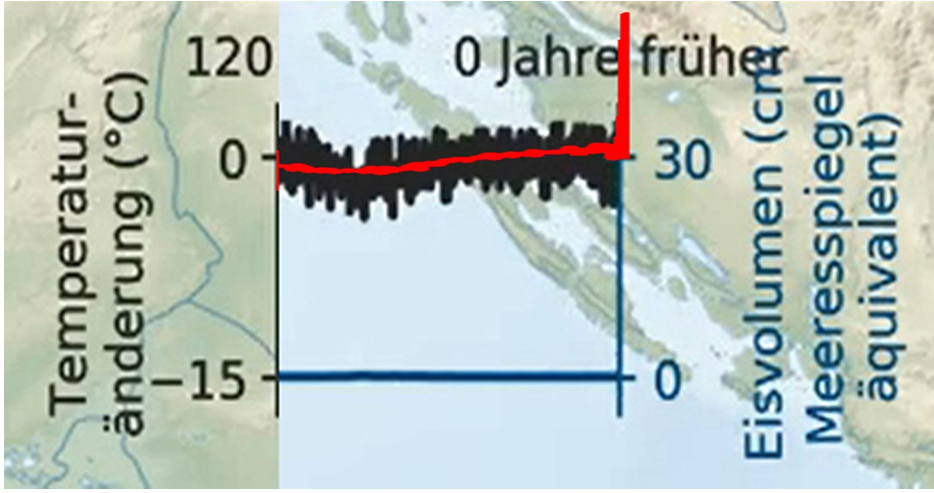
Figure 11: A closer look at the period of the last approx. 10,250 years – i.e. long after the end of the last glacial period and into the beginning of the industrial age (graphic: author + screenshot from https://www.youtube.com/watch?v=TXzExbdHuDM)
As shown in Figure 11, the average temperatures fluctuated considerably between the end of the last glacial period and the start of the industrial age. The range was between -4 and +3 °C compared to today’s average. In contrast, during this period, CO2 levels varied only within an extremely narrow range between 258 and 285 ppm. This does not really fit in with the purported correlation between CO2 and temperature, which has been declared an infallible truth by the highest German court. For comparison, here is another passage from the Federal Constitutional Court’s climate ruling:
“Up to what level and at what speed the temperature will continue to rise depends on the proportion of greenhouse gases in the atmosphere and thus largely on the amount of anthropogenically emitted greenhouse gases, especially CO2 emissions (IPCC, op. cit., pp. 17 f., 26). This is because there is an almost linear relationship between the total amount of greenhouse gases emitted and the rise in mean surface temperature (SRU, Demokratisch regieren in ökologischen Grenzen – Zur Legitimation von Umweltpolitik, Sondergutachten, 2019, p. 36)” (bold highlights added by the author).
History of Alpine glaciers does not support the CO2 greenhouse gas hypothesis
Climate science claims that there is a linear relationship between the CO2 content of the atmosphere, influenced by anthropogenic emissions of greenhouse gases, and temperatures on the Earth’s surface. The detailed investigation of the course of the last glacial period with regard to temperatures and ice cover in the Alps using complex simulations provides no evidence for this. Comparatively minor changes in CO2 levels in the atmosphere are probably due to temperature-related changes in the solubility of the gas in the oceans (Henry’s law).
The same applies to the period of the current warm period over the last 10,500 years or so. With comparatively stable CO2 levels, temperatures fluctuated within a range of -4 to +3 °C. The Alpine glaciers are therefore more like key evidence that the CO2 greenhouse gas hypothesis is treading on rather thin ice. Whatever it is that determines our climate, it is highly unlikely to be CO2!
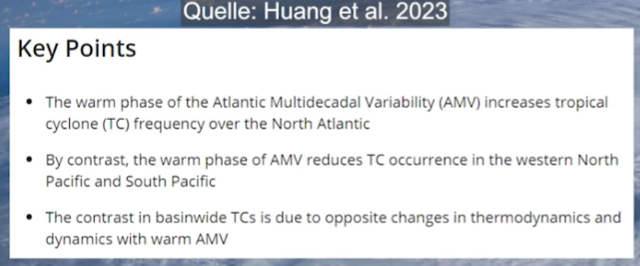
The paper examines the influences of Atlantic Multidecadal Variability (AMV) on global tropical cyclones (TCs)
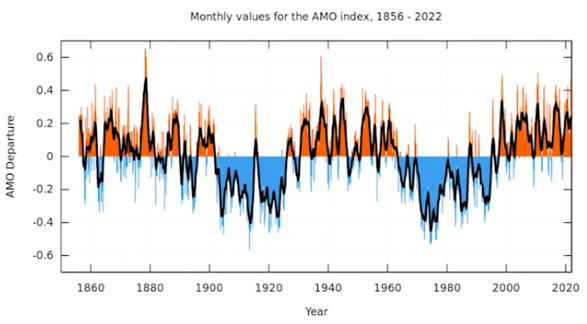
The north Atlantic undergoes approximately 60-year cycles of warmer and colder than normal sea surface temperatures. These changes in thermal surface energy play a role on modulating climate globally, especially in combination with other oceanic cycles.
Compared to the AMV negative phases, the AMV positive phase “significantly increases tropical cyclone frequency in the North Atlantic, including those making landfalls,” The authors found. “The increase is explained by warmer sea surface temperature, higher relative humidity, increased relative vorticity, and weaker vertical wind shear under the AMV positive phase.”
“By contrast, AMV positive phase decreases TC occurrence over the western North Pacific and South Pacific, which is tied to stronger vertical wind shear and lower relative humidity. The opposite responses of TC activity to AMV positive are attributed to strengthened Walker Circulation between the Atlantic and Pacific.”
Under CO2 science, alarmists like to claim that tropical storms frequency is simply trending up and up due to manmade CO2 warming. But in fact, tropical storm frequency is far more linked to oceanic cycles.
The key points of Huang et al 2023:
So the next time we get an active tropical cyclone season, you’ll know that it has more to do with natural oceanic cycles, which we are unable to control, and it all has little to do with CO2 emissions which the media like to hype up.
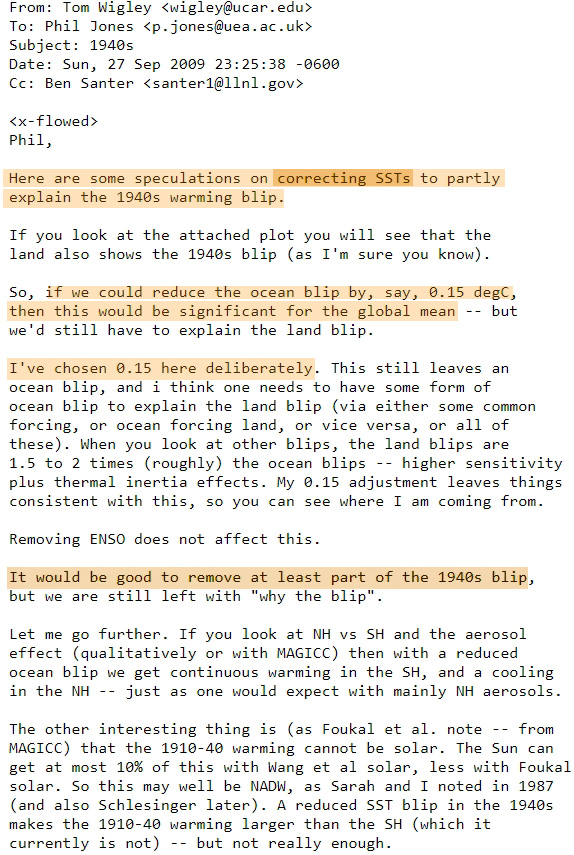
The amplitude of the recorded warmth in the 1940s was always a problem for purveyors of the human-caused global warming narrative. So the 1940s temperatures have been artificially cooled to make this less of a problem.
“So, if we could reduce the ocean blip by, say, 0.15 degC, then this would be significant for the global mean — but we’d still have to explain the land blip.”
“I’ve chosen 0.15 here deliberately.”
“It would be good to remove at least part of the 1940s blip, but we are still left with ‘why the blip?’.”
And, just as they had said they would do, 0.15°C of warmth has gradually been removed from the 1940s HadCRUT global temperature data over the last 15 years. They have “corrected” the data to align with their narrative.
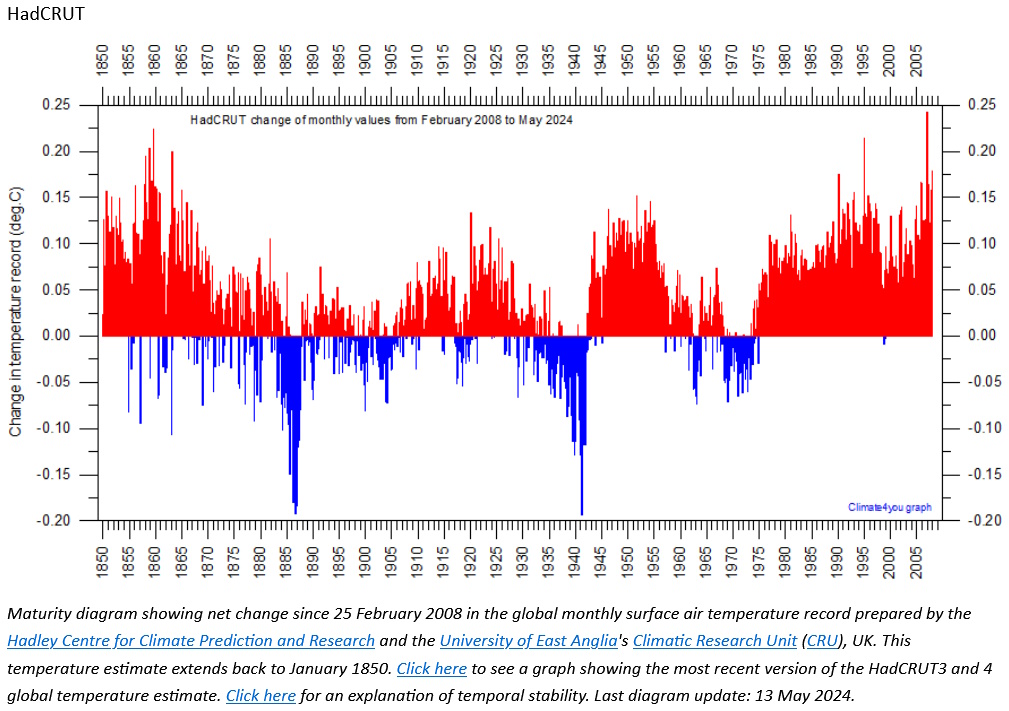
What’s also noticeable here in this HadCRUT-changes-temperature-data chart provided by climate4you is just how much warmth has been added to 21st century temperatures since 2008.
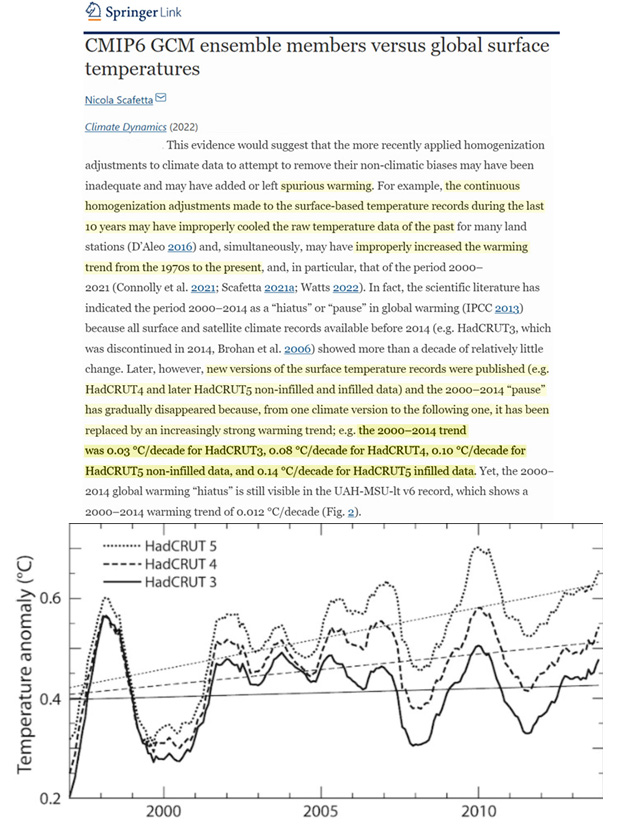
The HadCRUT3 global temperature trend was recorded as 0.03°C per decade during the global warming hiatus years of 2000-2014 (Scafetta, 2022).
This was increased to 0.08°C per decade by version 4, as the overseers of the HadCRUT data conveniently added 0.1°C to 0.2°C to the more recent anomalies.
Today, in HadCRUT5, the 2000-2014 temperature trend has been adjusted up to 0.14°C per decade when using the computer model-infilling method.
So, within the last decade, a 15-year temperature trend has been changed from a pause to a strong warming. After all, when the observations don’t fit the narrative, it is time to change the observations.
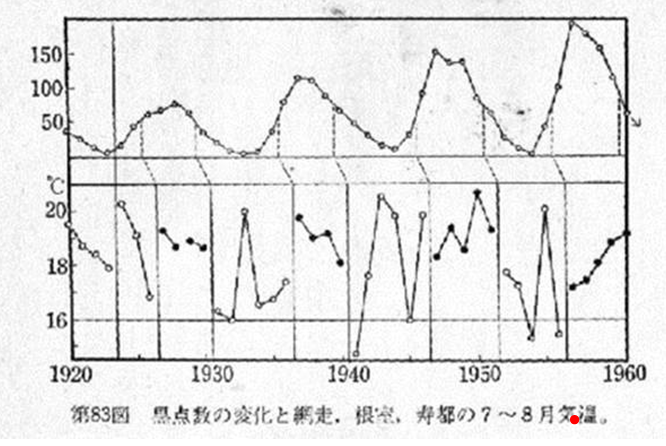
In 1962, Japanese meteorologist Hirohide Saito found the instability of summer temperature of Hokkaido (northern part of Japan) during the solar minimum as follows:
Fig.1 Instability of summer temperature (white circle) of Hokkaido
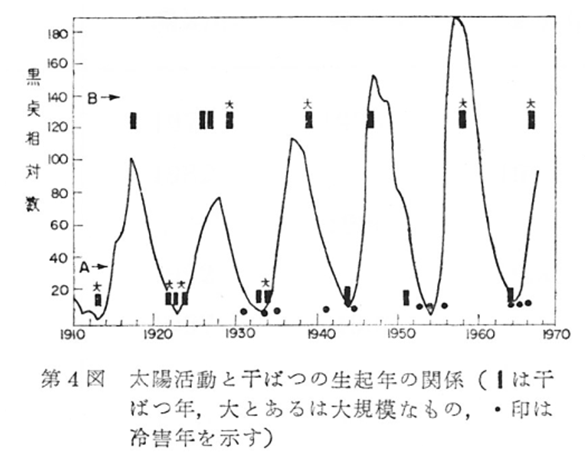
In 1967 Japanese meteorologist Junkichi Nemoto published the following graph, below, showing that drought in Japan occurs at the solar minimum as well as at the solar maximum. Further Nemoto showed the drought occurs with the crop failure due to the low temperature in the northern part of Japan at the solar minimum. This is coincident with Saito’s finding above showing the instability of summer temperature at the solar minimum in Hokkaido.
Fig.2 Drought at the solar minimum (A series) and at the solar maximum (B series); black bar (drought) , black dot (rice crop failure due to low temperature in the northern part of Japan)
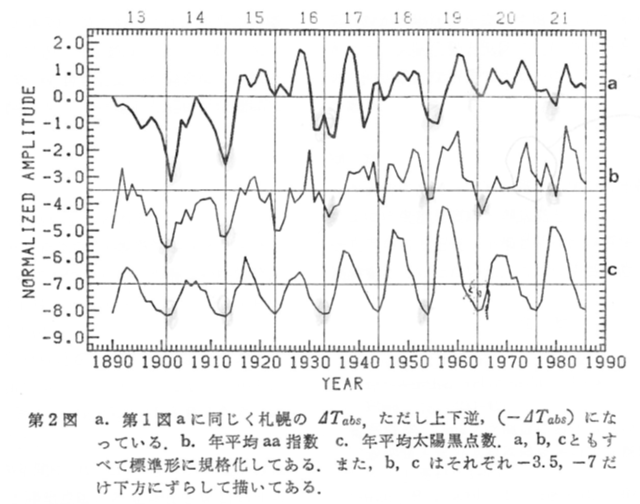
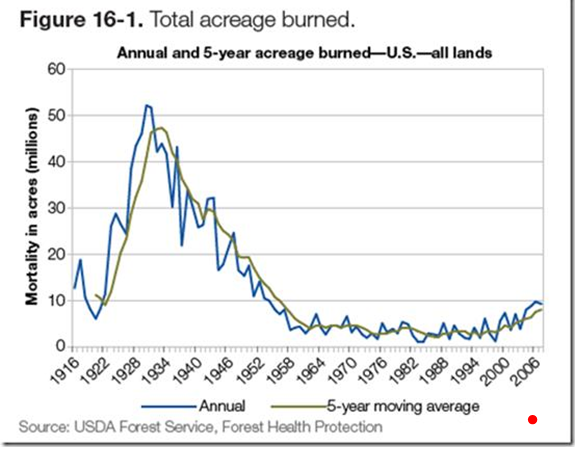
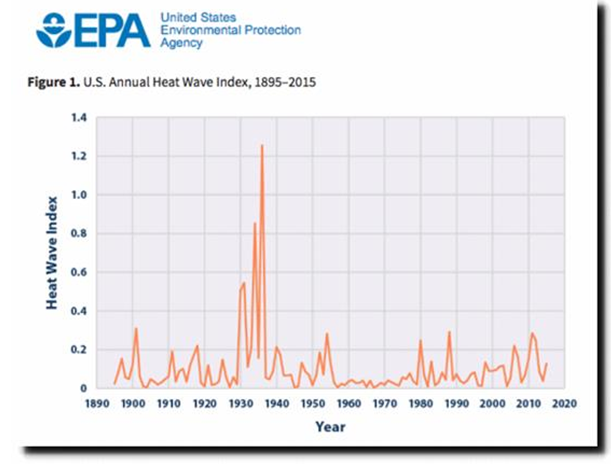
In 1988, based on the meteorological studies above, Japanese climatologist Kunihiko Kodera published the following graph showing the jet stream blocking frequency is higher at the sunspot minimum and the aa index minimum. The graph shows the highest frequency of the jet stream blocking during 1931-1936, which is coincident with the highest U.S. heat wave index and the highest burned forest area below.
Fig.3 Relation between the frequency of blocking days and solar activity; a is the inverse of proxy for blocking days frequency; b is geomagnetic aa index of solar activity; c is sunspot data.
Junkichi Nemoto, “Drought at the western area of Japan during summer to autumn in 1967 (in Japanese) “, Tenki (Weather in Japanese), Vol. 14, No.12, 1-7 (Dec.1967).
Kunihiko Kodera, “ Summer temperature at Sapporo area and solar activity (in Japanese) “, Tenki (Weather in Japanese), Vol. 35, No.5, 33-35 (May, 1988).
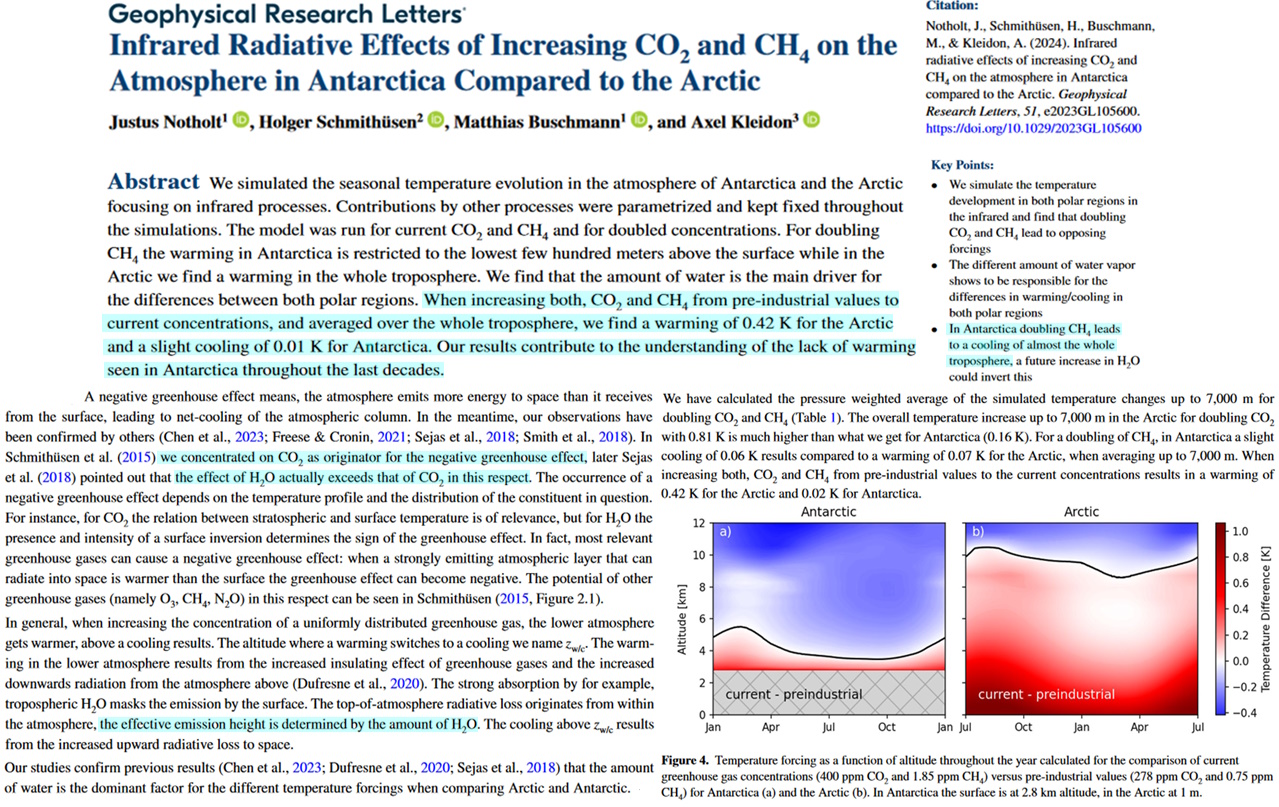
The phenomenon of increasing the concentration of greenhouse gases (water vapor, carbon dioxide, methane) is assumed to lead to sharply rising temperatures in polar regions, or “polar amplification.” As it turns out, it doesn’t.
Per a new radiative forcing model (Notholt et al., 2024), increasing CO2 from pre-industrial to present levels (278 to 400 ppm) results in a slight cooling effect for all of Antarctica (-0.01°C), reinforcing the “negative greenhouse effect” conclusion of previous studies.
The increased CO2 concentration does result in a warming for the Arctic in their model, but only 0.42°C for the 122 ppm increase. This implies CO2 cannot be responsible for the bulk of modern Arctic warming.
It was also determined that for Antarctica, “doubling CH4 leads to a cooling of almost the whole troposphere.”
The negative greenhouse effect of water vapor – Earth’s main greenhouse gas – dominates over CO2 with regard to climate impacts in polar regions.
The authors suggest their results provide an explanation for the “lack of warming seen in Antarctica throughout the last decades.”
Volcanologist and ultra-hysterical climate scientist Prof. Bill McGuire posted a comment on X: “If I am brutally honest, the only realistic way I see emissions falling as fast as they need to, to avoid catastrophic #climate breakdown, is the culling of the human population by a pandemic with a very high fatality rate.”
Reaction McGuire’s comment came swiftly and harshly, so much you that McGuire took down the callous comment, claiming he didn’t mean it and that readers misinterpreted the comment.
If anything, it tells us what kind of twisted fantasies are floating around in the heads of the members of the climate doomsday cult.
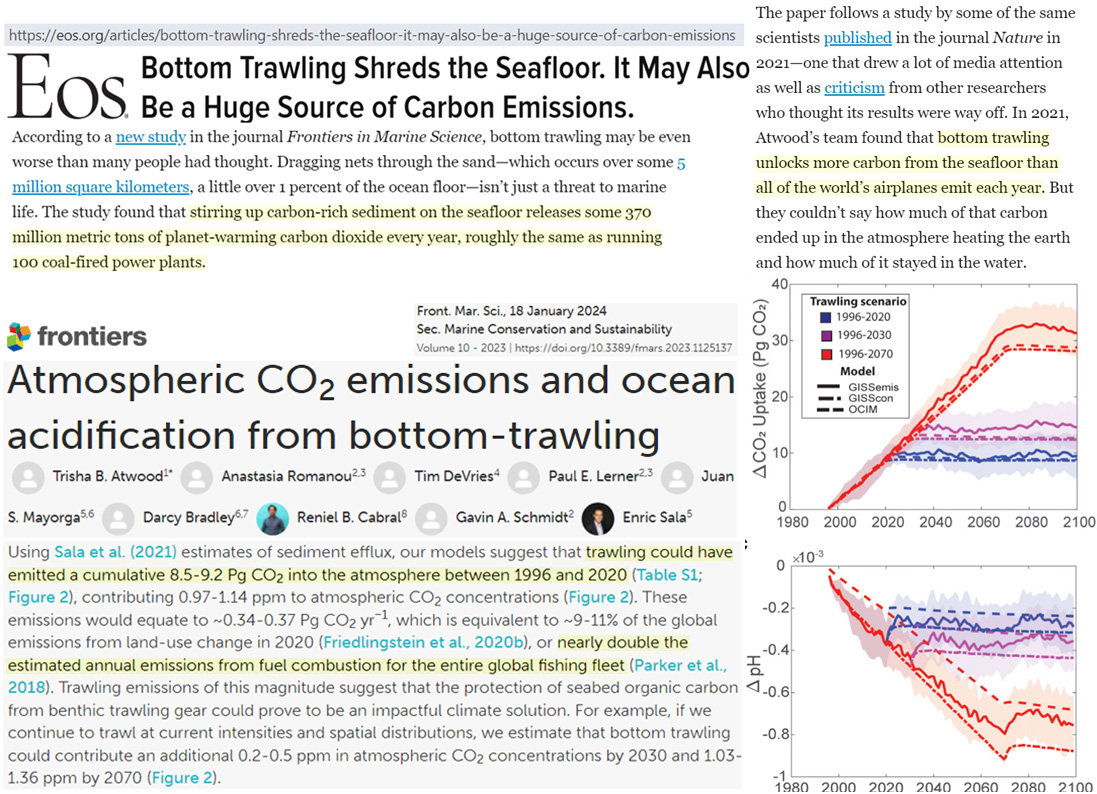
Disturbing resting seafloor CO2 is yet another way humans are believed to be heating up the planet.
Only 1% of the seafloor has been molested by dragging nets through the sand (trawling) in an effort to retrieve the seafood staples we enjoy. But that’s enough to wreak havoc on the Earth’s climate at the top of the atmosphere, 100 km above the ocean surface, where CO2-induced global boiling is activated.
According to a new study and its press release, trawling the ocean floor for shrimp and cod disturbs the “planet-warming carbon dioxide” that had until then been peacefully reposed in sentiment. Dragging nets along the ocean floor “unlocks more carbon from the seafloor than all the world’s airplanes emit each year,” some 370 million metric tons worth.
And, of course, this acidifies the ocean too. When in its undisturbed state, the massive quantities of seafloor CO2 hadn’t been causing ocean acidification. But then as soon as the nets were dragged along the seafloor by humans, the disturbed CO2’s acidification potential was unleashed.
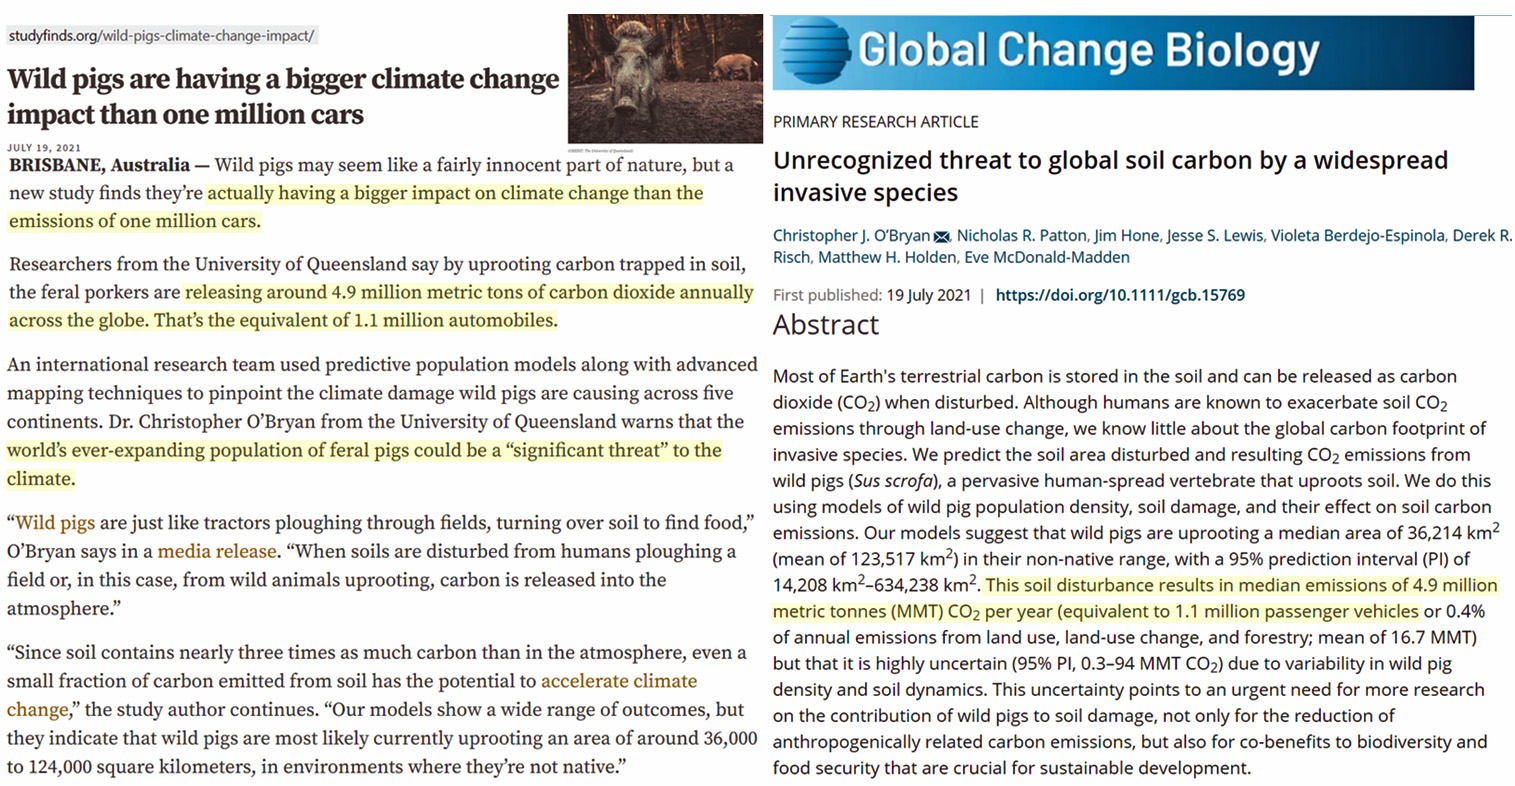
In others news along this front, we are told (O’Bryan et al., 2021) that “wild pigs are having a bigger climate change impact than one million cars” because they are now, for the first time (ever?) trampling over dirt outside of their “native range.”
Had they stayed in their confined wild pig area, their “native range,” the CO2 they released from the soil as they trampled across it would not have had any climate impact. But the dirt these wild pigs are disturbing now has CO2 in its at-rest state in it, and thus “this soil disturbance results in median emissions of 4.9 million metric tonnes (MMT) CO2 per year (equivalent to 1.1 million passenger vehicles).”
Wild pigs are now classified as an “invasive species” delivering a previously unrecognized global carbon footprint “threat” by uprooting soil outside of their lane.
At the European Institute for Climate and Energy (EIKE) YouTube account, the young EIKE climate lady delivers the latest climate video, focusing on the Himalayas, which, as some of you may recall, would go ice-free by 2030, according to Prof. Hans-Joachim Schellnhuber.
Yes, the authors are implying that global warming is leading to a cooling in the Himalayas, we suppose much like the junk science that global warming is leading to more and more snowstorms and harsher winters.
In the paper, the authors write that they found “a decrease in maximum air temperature” during the last three decades “in response to global warming.”
The authors believe the “counterintuitive cooling is caused by enhanced sensible heat exchange and the associated increase in glacier katabatic wind, which draws cool air downward from higher elevations.”
“The stronger katabatic winds have also diminished precipitation in glacial areas, thus negatively affecting glacier mass balance.” the authors suspect. “This local cooling may have partially preserved glaciers from melting and could help protect the periglacial environment.
No matter what happens, it’s caused by global warming, junk science fabricators insist!
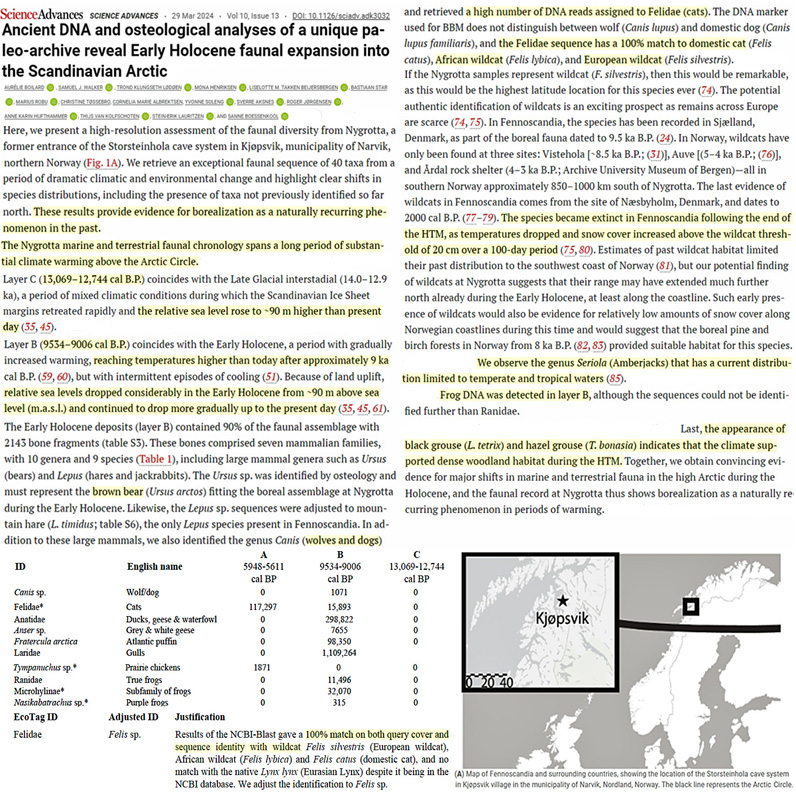
A new study finds warmth-demanding species could survive in the Holocene Arctic (northern Norway) hundreds to thousands of km north of where they reside today. This affirms temperatures were “higher than today” with much less snow and ice back then.
DNA evidence from a site north of the Arctic Circle indicates African wildcat (Felis lybica) used to reside in Arctic climates when CO2 levels were under 260 ppm, or at supposedly “safe” levels. The authors suggest this is a “remarkable” finding, as it is the “highest latitude location for this species ever.”
The presence of domestic cats (Felis catus) and European wildcats (Felis silverstris) in this region is also validated by 100% matching DNA evidence. Wildcat species became extinct in northern Europe after the Holocene Thermal Maximum (HTM) ended and “snow cover increased above the wildcat threshold of 20 cm over a 100-day period.”
Amberjacks (Seriola) – a fish species only found in temperate to tropical Pacific and Atlantic waters (Gulf of Mexico, Brazil) today – also lived north of the Arctic Circle during the Early Holocene.
Dogs (wolves), ducks, geese, prairie chickens, gulls, brown bear, and several species of frogs (no longer present in the Arctic today) also found the Arctic climate temperate enough to reside in northern Norway in the millennia centering around 9000 years before present.
The presence of mussel shells at much higher elevations indicate sea levels were ~90 m higher than today 13,000 to 12,000 years ago in this region (due mostly to uplift), falling to ~57 m higher than present between 9500 and 9000 years ago and then gradually declining to the present.
The authors suggest the DNA-confirmed presence of these species north of the Arctic Circle – much further north of where they can survive today – is evidence that warming periods and borealization were “a naturally recurring phenomenon in the past.”
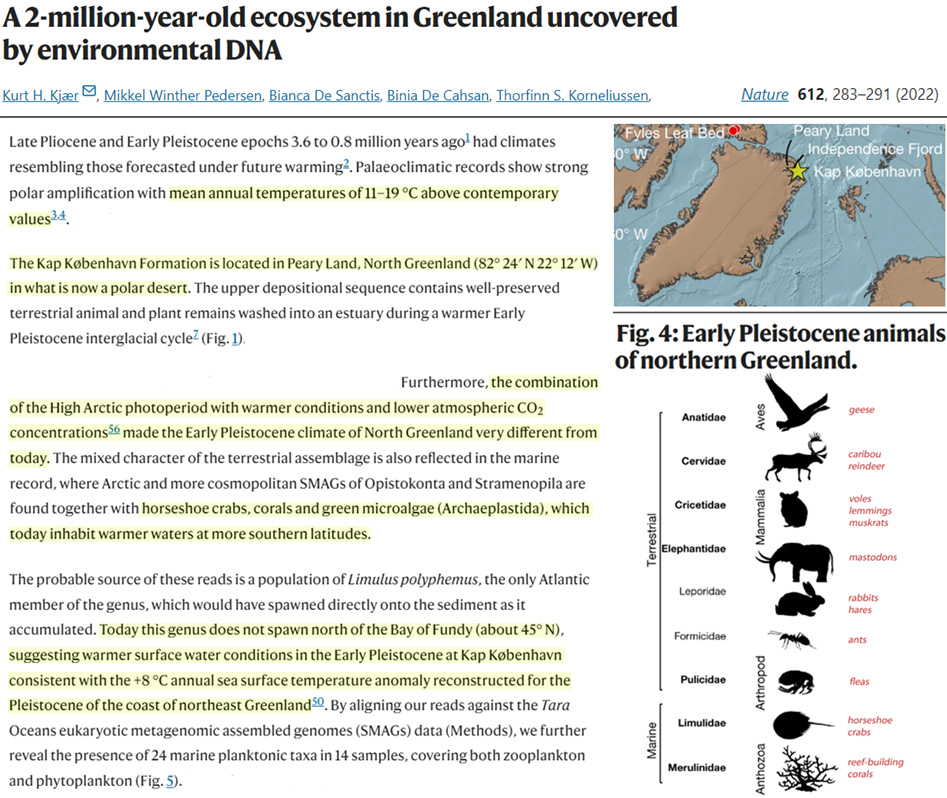
DNA analysis of species remains has become an insightful way to analyze past variations in climate. Another recent DNA database study (Kjaer et al., 2022) published in Nature indicated the High Arctic at 82°N (north of Greenland) was 11-19°C warmer than today 2 million years ago. This warmth allowed coral reefs, green algae, and horseshoe crab to reside in the Arctic Ocean at 82°N. Today horseshoe crab cannot occupy waters north of 45°N due to the much cooler ocean temperatures.
German weather site wetteronline.de reported “extreme winter cold” in Antarctica as the mercury plummeted to “almost minus 80 degrees Celsius” on April 29, 2024.
“On April 29, almost minus 80 degrees were measured at the Russian Vostok research station. Such extreme cold is rarely reached this early in the year,” reported wetteronline.de.
The record, -89.3°C, was recorded in the middle of winter, on July 21, 1983, thus making the last week’s late April reading very unusual.
“Values below minus 80 degrees in April are also extremely rare at the Earth’s cold pole and have only been recorded three times in the last 60 years,” wetteronline.de adds.
Der Spiegel reports: Germany e-car industry is a crisis headed for a catastrophe. New Tesla unsold cars now being parked in an old airfield.
Germany’s 2030 e-car target now a lunatic fantasy
Sales of e-cars in Germany are plummeting, signaling more trouble for the country’s move to a green society. Overall, for Q1 2024, EV sales declined by around 14.1% compared to Q1 of 2023. For Tesla, the picture is much uglier.
Though the country would like to blame something else other than its terrible policies, this misery is not due to the Ukraine War.
As Spiegel reports, The cars are just too expensive and impractical, and the government has stopped subsidizing sales.
35% drop in Tesla new registrations
Der Spiegel focusses on Tesla’s Gigafactory located in Grünheide, roughly 30 kilometers southeast of central Berlin. The once electrifying future for the e-car maker has since turned into a huge nightmare. Though the Grünheide plant continues to churn out e-cars, Der Spiegel looks at where the 100s of truckloads of e-cars are in fact being being shipped. Unfortunately for Tesla, many are not going to buying customers. In Q1 of 2023, 20,000 new Teslas were registered in Germany, according to Der Spiegel. But this year in Q1, only 13,000 were registered – a whopping 35% drop!
Storage at an old airfield
Der Spiegel reporters followed the Tesla transport trucks and discovered that many are being shipped to an old airfield for storage. In the report, a Tesla security officer, however, arrives (in an internal combustion engine car) and refuses Spiegel to make photos of the embarrassing situation (4:24 mark). Tesla management refuse to comment on the mass electric car storage.
Overall in Germany, e-cars of just about every type have lost their attractiveness, and buyers are shunning them.
Green fantasy
As the popularity of electric cars in Germany tanks, the governments 2030 target of getting 15 million e-vehicles on the road now looks like a lunatic fantasy.
By continuing to use the site, you agree to the use of cookies. more information
The cookie settings on this website are set to "allow cookies" to give you the best browsing experience possible. If you continue to use this website without changing your cookie settings or you click "Accept" below then you are consenting to this. More information at our Data Privacy Policy
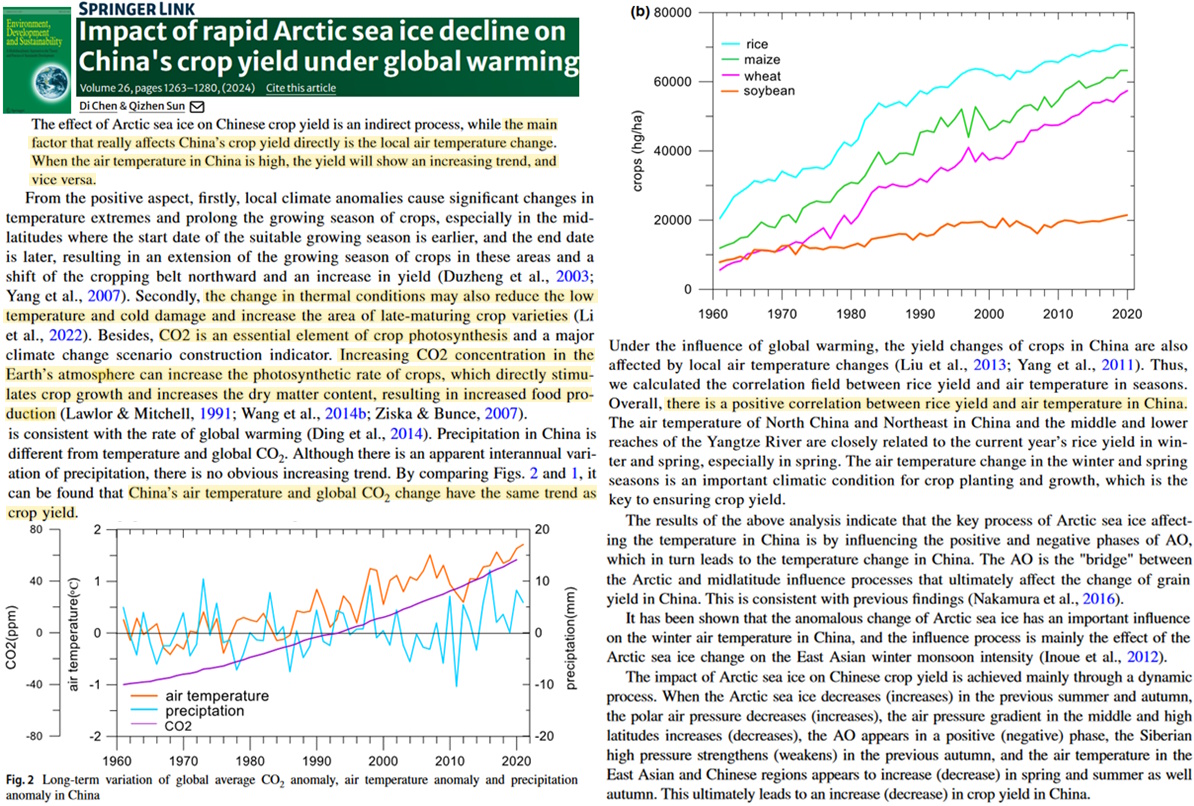
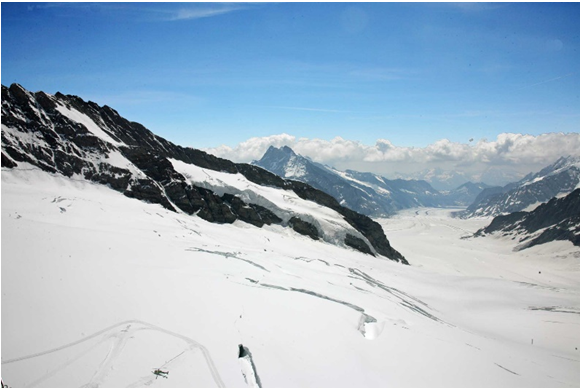
 Figure 2: The so-called
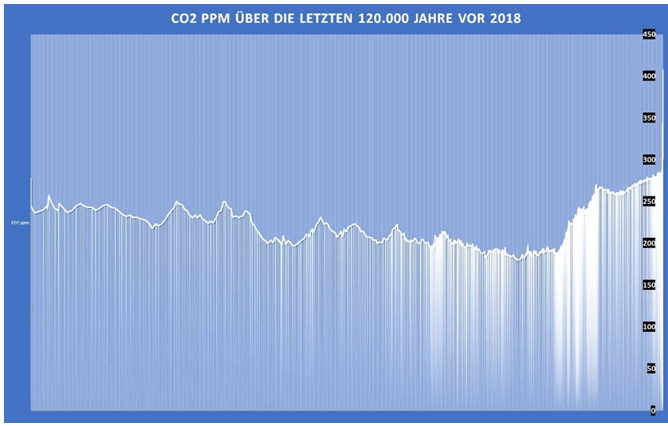


Recent Comments